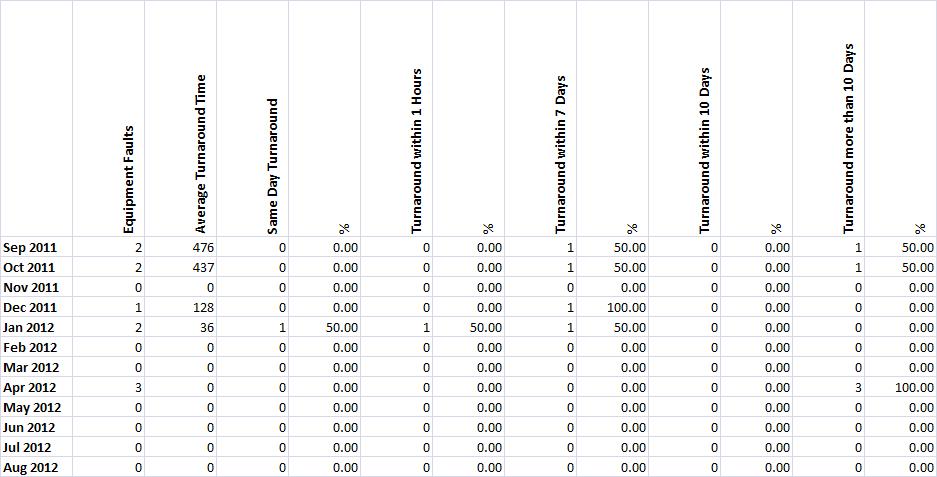
Equipment Fault Efficiency Performance Indicators
The KPI SIG’s (Special Interest Groups) identified that two main performance indicators were required to describe how effectively equipment faults are dealt with. These are response time and turnaround time. Both of these KPI’s generate statistics on a month-by-month basis. Just as the PPM analysis is grouped by device risk, so the equipment fault analysis is grouped by job priority. We think that there is little point in combining statistics for different priorities. For example, to quote an average response time is meaningless if it hides the fact that non-urgent jobs are responded to very quickly, with urgent jobs being responded to very slowly.
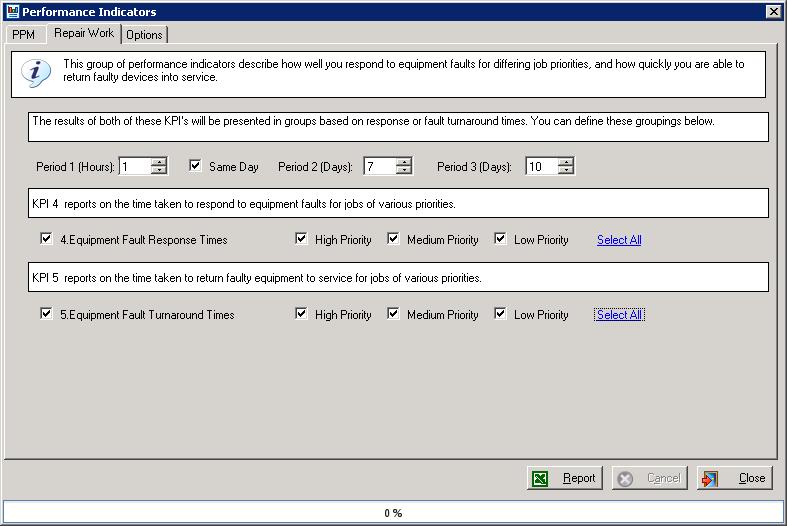
When running these KPI’s you can choose the reporting period by specifying a start date and a number of months and you can also choose which job priorities you wish to generate statistics for.
The statistics are presented using Microsoft Excel based on a template located in the Reports folder beneath the e-Quip installation path. This template can be modified to include other calculations.
Reporting Bands
Each of the KPI’s examines jobs that were raised within a given month and calculates how quickly they were responded to or the faults were addressed. When running the KPI’s you can choose how these statistics should be grouped together. In the example above the bands selected are 1 hour, same day, 7 days and 10 days. An additional band will always be calculated and displayed which is all items greater than the widest band. Thus in this example there will be a further band: more than 10 days. This additional band also includes any records for which no evidence is available.
With the PPM KPI’s a single device can only appear in a single band. This is because the bands cannot overlap. However, for the equipment fault KPI’s the bands are not all defined with the same units: one is specified in hours, one as the same calendar day, and the others in days. It is possible (although not certain) that a job completed in 5 hours would appear both in band 1 and the same day band. If the first band is set to 6 hours then the job would appear in that band, but it would only appear in the same day band if the 5 hour completion time did not cross the midnight boundary.
Dates
The analysis allocates jobs to months based solely on the job Call Date field. This implies that only jobs with call dates will be included in the analysis.
For the fault response KPI the response date is taken to be either the value in the job Response Date field, or, if that is empty, the job Equipment Received Date field, or if that too is empty, the job Work Start Date field.
When calculating the job turnaround time, the date that the fault was rectified is taken as either the job Equipment Returned to Owner field, or, if that is empty, the job Work End Date field.
1. Equipment Fault Response Times
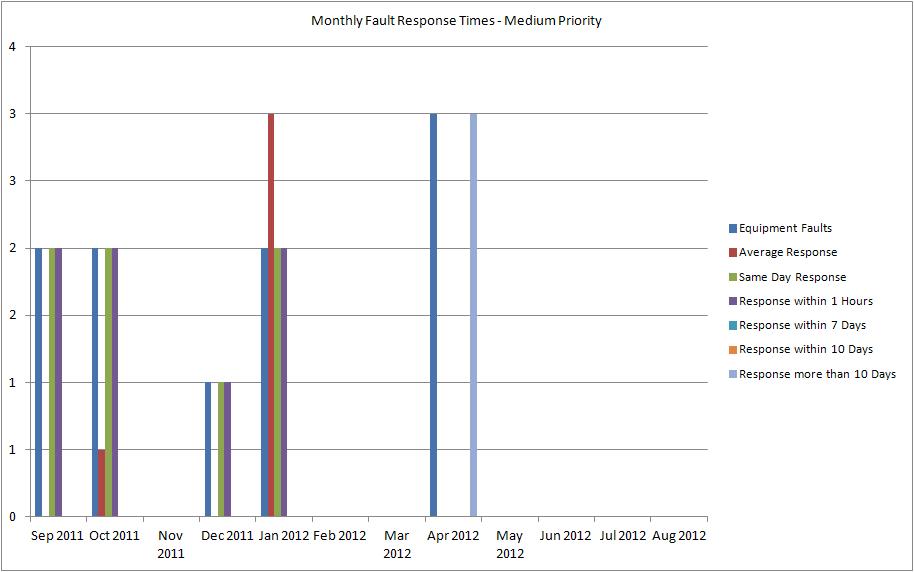
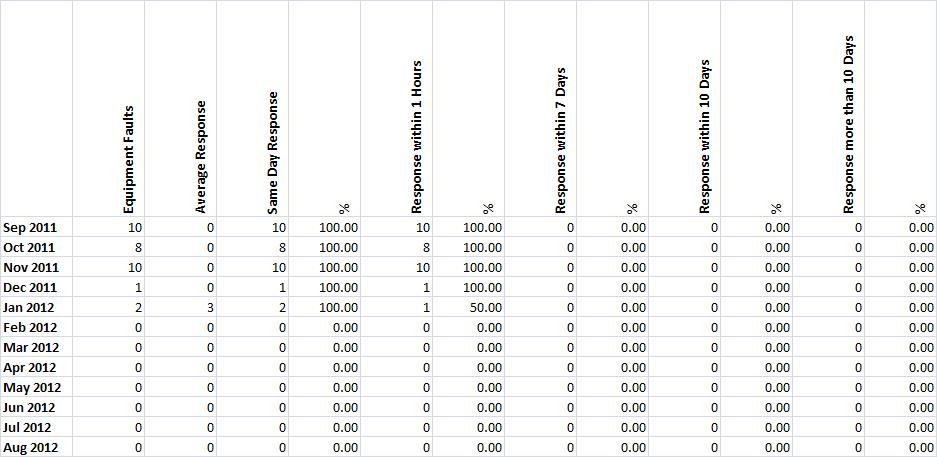
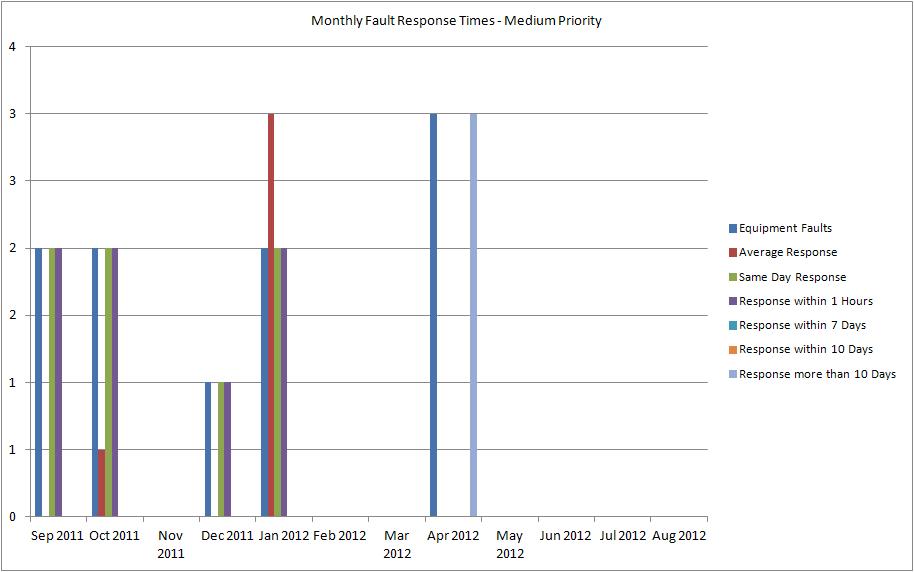
This KPI shows, on a month-by-month basis, the response times for the jobs raised in that month. It is presented both graphically and in tabular format.
2. Equipment Fault Turnaround Times
This KPI shows, on a month-by-month basis, the turnaround times for the jobs raised in that month. It is presented both graphically and in tabular format.
Fault turnaround time is defined as the time taken between a fault being reported and being addressed.

