Planned Maintenance Performance Indicators
A performance indicator is a numeric value which measures some aspect of organisational performance. In the context of e-Quip they would be quantitative values which allow some aspect of medical device management to be measured. Common performance indicators in this field might be equipment downtime, availability, mean time between failure etc. This article concerns performance measurement with relation to planned device maintenance.
Key Performance Indicators (KPI’s) are most useful when used to measure compliance with, or progress towards some stated goal. It is important to design KPI’s which have both what Internal Validity and Construct Validity. Construct validity means that the things that you are measuring are actually indicators of the aspect of performance which you are trying to quantify. Internal validity, on the other hand, means that there is a causal relationship between the quantity that is being measured and the target or goal that you are trying to assess. For example, while simply counting the number of PPM jobs completed per month might be an interesting statistic for other purposes, it does not have construct validity if you are using it to measure your compliance with your PPM schedule, and is therefore not meaningful as a KPI for that purpose.
Planned maintenance of medical devices is effectively a risk-management strategy and risk management normally involves classification or quantification of risks so that resources can be targeted towards ameliorating higher-level risks. In e-Quip, risk classification is central to the planned maintenance KPI’s – all of the PPM KPI’s are presented grouped by risk level. We see no value in presenting combined statistics across multiple risk levels. To say that 99.9% of your inventory is compliant with your PPM schedule is meaningless if this statistic hides the fact that 1000 low-risk devices are fully compliant while 10 high-risk devices are not.
Another important point about our KPI’s is that they are evidence-based. It is not enough to simply state “we planned to achieve X and we have achieved Y”; in the absence of evidence this statement is unsupported and cannot be verified. For planned maintenance this evidence takes the form of job records.
What Should be Measured?
It is difficult to find any consensus amongst medical device managers as to what metrics are actually required (and meaningful). In the discussion which follows we use the term PPM Schedule to mean the plan according to which devices are maintained. This schedule is your stated intention of what devices you plan to maintain and when you plan to carry out this maintenance. All of the e-Quip PPM KPI’s relate to this schedule and your compliance (or non-compliance) with it.
After consultation with our users we decided to measure:
1. KPI 1: Current Compliance
a. The number of devices which should be maintained.
b. The number of those devices which currently comply with your PPM schedule. i.e. devices for which maintenance is not overdue.
c. The number of those devices which do not currently comply with your PPM schedule.
d. Backlog analysis of the non-compliant devices. For example, of the non-compliant devices, how many are X, Y or Z days overdue for maintenance (where values for X, Y & Z can be optionally specified when generating the KPI’s).
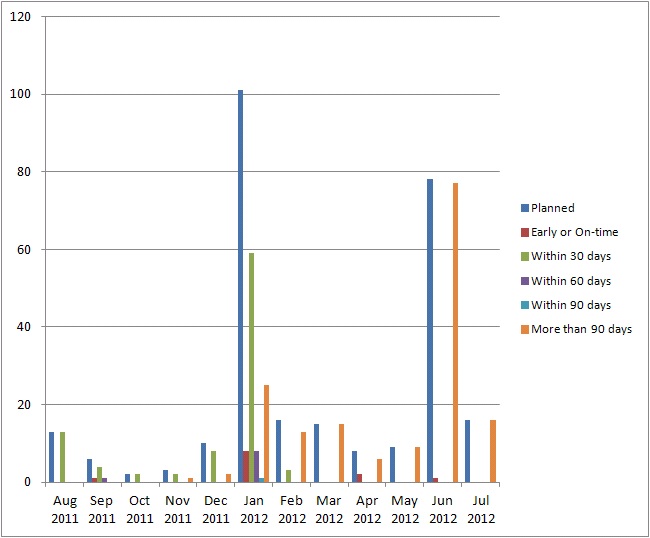
2. KPI 2: Monthly Compliance
On a month-by-month basis within a specified date range:
a. How many devices had maintenance planned in that month
b. Of the those, for those devices for which the maintenance has been completed, how timely was the completion. For example, of the compliant devices, for how many was the maintenance completed early or within X, Y or Z days of their planned maintenance dates (where values for X, Y & Z can be optionally specified when generating the KPI’s)
For example, in January 2012, 200 devices may have been scheduled for maintenance. Of those, 35 may have been done early or on-time, 85 may have been done within 30 days of the due date, 25 may have been done within 60 days, 10 may have been done within 90 days, 10 in more than 90 days with the remainder (35) not having been done at all.
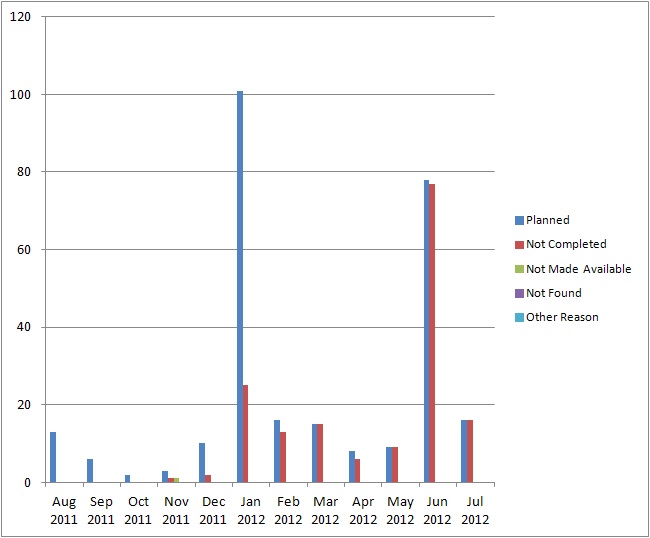
3. KPI 3: Monthly Non-Compliance
On a month-by-month basis within a specified date range:
a. How many devices had maintenance planned in that month.
b. Of the those, for how many devices was the maintenance not completed.
c. Of the devices whose maintenance was not completed, how many were uncompleted because the device was not made available. For example, the device may have been in use by a patient.
d. Of the devices whose maintenance was not completed, how many were uncompleted because the device could not be found.
e. Of the devices whose maintenance was not completed, how many were uncompleted because of some other reason.
We believe that these metrics give an indication of how effectively the PPM schedule is being adhered to. Of course some managers will agree and some will disagree. If you have any suggestions then feel free to pass them on to us.
Defining Your Plan
Your high-level strategy for planned maintenance will initially be defined in words as part of your departmental policies. Two examples of policy statements are shown below.
ALL MEDICAL DEVICES ARE TO BE MAINTAINED IN ACCORDANCE WITH THE MANUFACTURERS’ INSTRUCTIONS
or
80% OF ALL HIGH-RISK MEDICAL DEVICES ARE TO BE MAINTAINED IN ACCORDANCE WITH THE MANUFACTURERS’ INSTRUCTIONS
Having stated your strategic intentions a mechanism is needed to define in the database:
1. Which devices you plan to be covered by this policy. i.e. which devices will you actually maintain.
2. When should maintenance for each of those devices be carried out.
In e-Quip the requirement to carry out planned maintenance on a device can be defined in several ways:
1. By checking the PPM check-box on the category property page. This indicates that all devices of a certain type should be serviced.
2. By checking the PPM check-box on the model property page. This indicates that all instances of this model should be serviced.
3. By specifying a default service interval on the model property page
4. By linking an asset to a maintenance schedule
The KPI’s will assume that every device (with the exception of decommissioned assets) which satisfies one or more of these criteria should be serviced. Bearing in mind the importance of risk level already stated, a device must also have been assigned a risk level in order for it to be included in the statistics.
Recording when a Device was Serviced
In the introduction the importance of evidence to verify performance claims was noted. In e-Quip the primary auditable evidence that work has been carried out is the job record. For example, while you may enter “1/3/2012” in the Last PPM Date field for a particular device, this provides no evidence that the work was carried out. This evidence must take the form of a completed PPM job for the device with a completion date of 1/3/2012.
Note that this applies even to equipment which is maintained under contract by external companies. While a scanned letter from a supplier may (in legal terms) be evidence that a device has been serviced, it is not accessible to database searches and cannot be used as the basis for automated KPI generation. Quite apart from KPI considerations, it is advisable to create jobs for all work undertaken on a medical device, even if it does by a contractor. Not only does this give you a complete service history of a device but it also helps in verification that the contractor has complied with the terms of the contract.
All of the KPI’s use jobs as the basis of measuring what work has actually been done.
Recording when a Device Should be Serviced
If jobs provide evidence of when planned maintenance was actually performed, how is evidence recorded of when the maintenance was originally planned? Once again, this evidence is provided by jobs records. The definition that planned maintenance is due on a certain date for a given device is the existence of a PPM job for that device with the Planned Date field set to the appropriate value. Note that this applies equally to devices maintained in-house and those maintained by contractors.
The date that a device should next be serviced is central to the generation of the KPI’s – effectively if this date is in the past then the maintenance is overdue, while if it is in the future the maintenance is up to date. At first glance this may seem extremely simple, after all the equipment record keeps track of this in the Next PPM Date field. Things are not, unfortunately, as simple as they seem. It is very common practice that when maintenance is due on a device, engineering staff will search for it and try to perform that maintenance. If it can’t be found, or if it being used by a patient the owner is often notified and asked to make the device available. The engineers will then search again for the device but eventually they may have to give up. Commonly, the owner is notified and the current PPM job is closed with a job status which indicates the reason why the job could not be completed, such as NOT MADE AVAILABLE or NOT FOUND. Many people refer to this as a PPX. When this occurs, e-Quip creates the next PPM job in the same way as it would if the job were completed. The planned date of this job becomes the Next PPM Date that is displayed on the equipment record.
In this situation, even though the equipment Next PPM Date would be shown in the future, the device might in fact be several years overdue for maintenance. The KPI’s make use of an SQL function called PPMOverdueBy (which you can also use as a calculated column on the asset summary screen). This function looks back into the service history for a device to find the date that maintenance was successfully carried out, and then works forward from that date to find the first uncompleted PPM job. The planned date for that job is the date that maintenance is actually due.
This approach is used when measuring current compliance, i.e. the current state of your inventory. KPI’s 2 & 3 however are concerned with your achievements (or lack of achievements) in a given month compared with what you planned to do in that month. In this case PPX can be ignored – the Next PPM Date in the equipment record correctly indicates when you plan to service that device. The fact that the device may be well overdue maintenance is irrelevant from the point of view of your plan.
Running the KPI’s
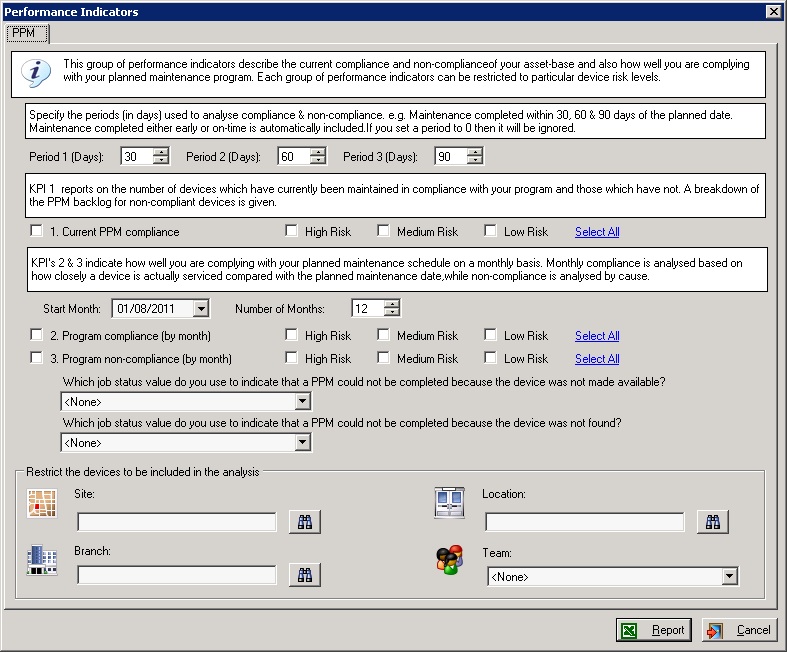
The KPI’s are generated from the e-Quip administration screen by clicking the KPI button on the Office ribbon. The screen below allows you to select which KPI’s you wish to generate and allows you to set the various parameters.
Displaying the Results
KPI 1 consists of 7 numeric values, 13 if the values are also displayed as percentages. KPI 2 has 6 (11 including percentages), and KPI 3 has 5 (9 including percentages). Bearing in mind that each KPI can be displayed in 3 variants, for high, low & medium risk levels, this collection of data consists of up to 99 data values. It is important that these data are displayed in such a way as to a) have immediate visual impact so that the points you are trying to illustrate are obvious, and b) the raw data are still available for further analysis. We achieve this using Microsoft Excel.
The output from the PPM KPI’s is a spreadsheet containing 10 worksheets. The first consists purely of charts which summarise the data in each of the other 9. The results of each KPI for each risk level are presented in individual worksheets: there are 3 KPI’s and 3 risk-levels. In each of the 9 worksheets the raw data is presented in both tabular and graphical format. In fact the raw data is displayed in 2 tables, 1 which contains all of the data values (including percentage equivalents), while the other contains only the base values. It is this 2nd table which is linked to the chart.
If you choose you can use this raw data to easily design your own charts.
(Note: Depending on your screen size and browser the following illustrations, especially the tabular data, may be difficult to read. However, all browsers provide a Zoom facility of some kind which will make the detail easier to read.)
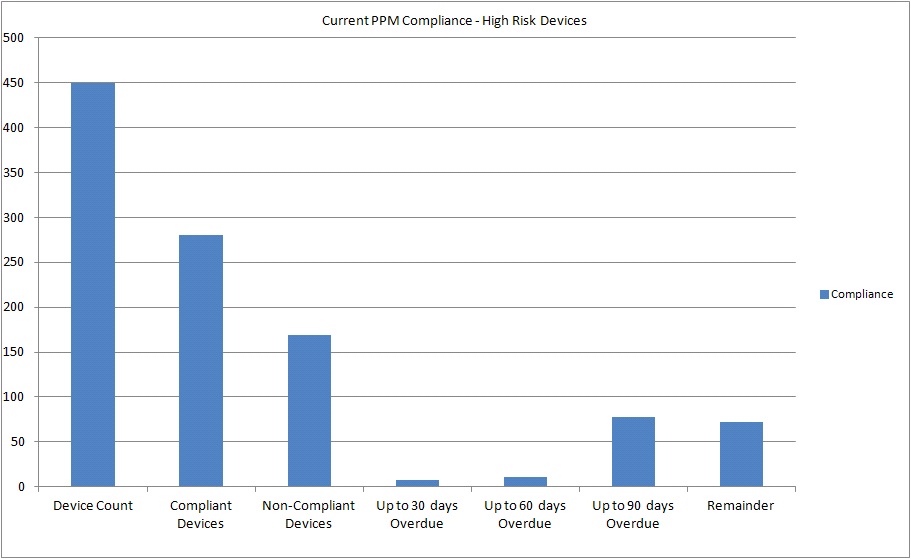
KPI 1 Chart
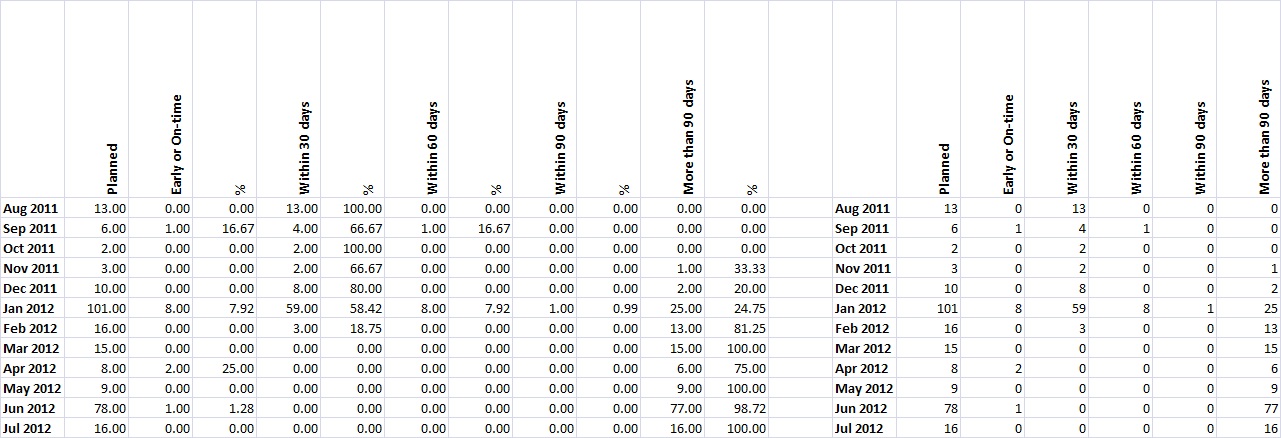
KPI 2 - Tabular Data
Conclusions
The e-Quip PPM KPI’s will be available from version 2.4.0. The metrics were chosen after consultation with two SIG’s (Special Interest Groups) which are members of the e-Quip user-group with a special interest in KPI generation. We believe that these metrics have internal validity and provide an accurate picture of your compliance with your PPM schedule. We hope that these KPI’s will be powerful and flexible enough to meet your needs, but if you have any suggestions then please feel free to get in touch.
